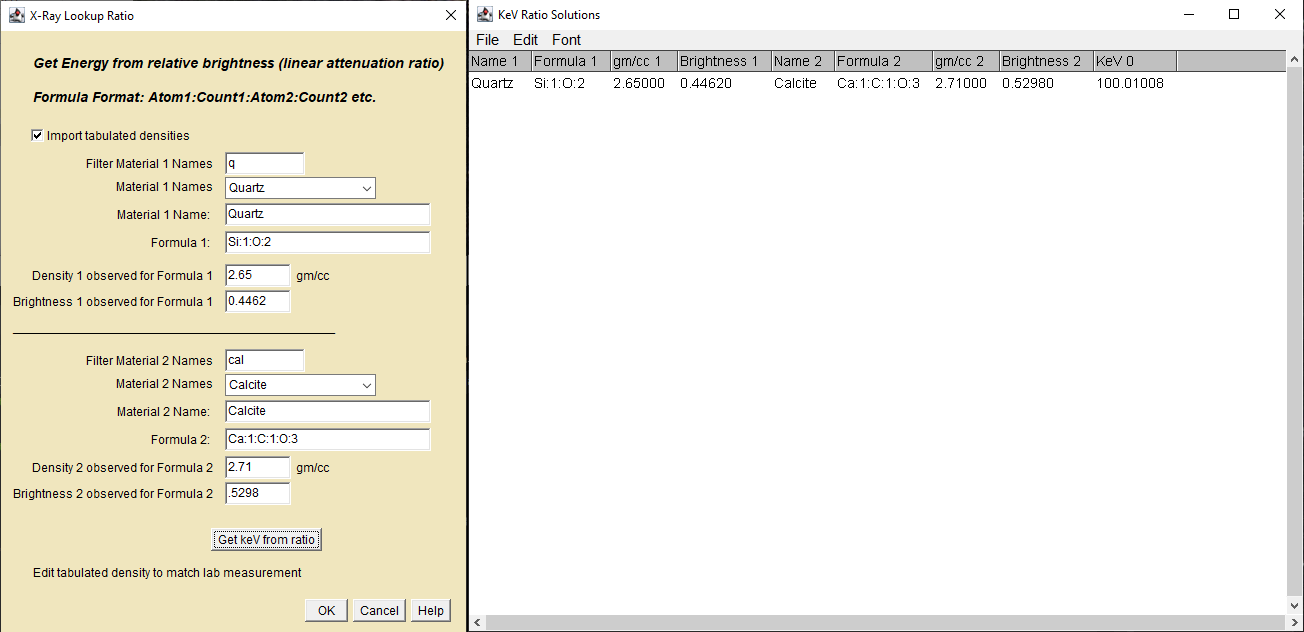
This figure shows the user dialog and the results window created and updated by X-Ray Lookup Ratio.
X-Ray Lookup Ratio indirectly obtains the photon energies from a contrast ratio. It is assumed that brighter features are more attenuating.
The look-up methods are intended to be used with internal standards of known composition and density. The standards should be placed at strategic locations on and within the CT scan specimen and each standard's attenuations measured in the reconstructed slices. These measurements are used to guide beam hardening corrections, if needed, and quantitative analysis of component concentrations. If standards cannot be used, then the specimen's materials can sometimes be used with limited success if the compositions and densities of the measured regions can be confirmed by independent analysis.
The plots below compare the barite/quartz and calcite/quartz contrast ratios as a function of photon energy.
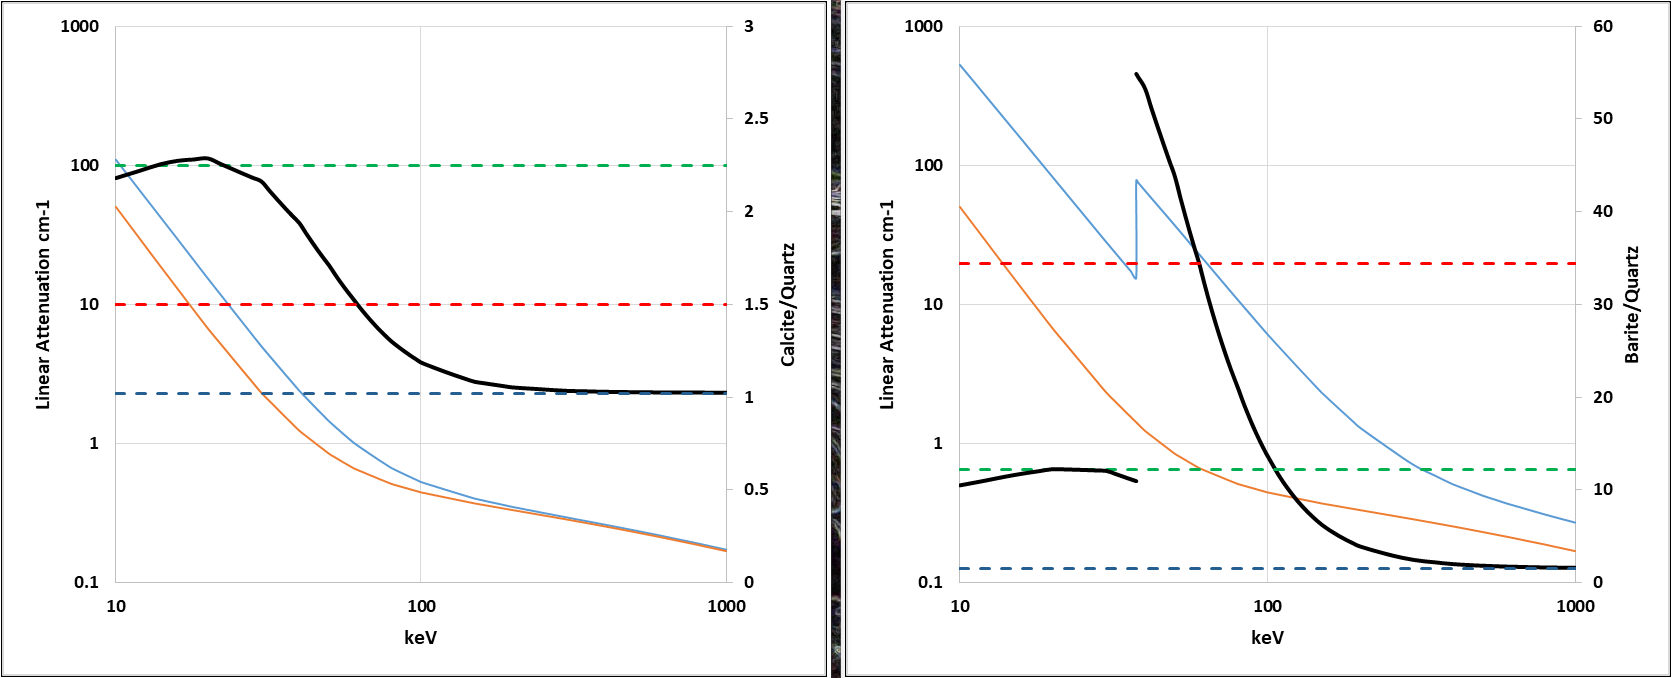
The heavy gray lines are the contrast ratios of (left) calcite (CaCO3) to quartz (SiO2) and (right) barite (BaSO4) to quartz (SiO2) as a function of x-ray energy. The blue lines are the linear attenuations of calcite(left) and barite(right)(The sharp discontinuity in barite is the K absorption edge) and the red lines are the linear attenuation of quartz.
The right vertical axis is the contrast ratio. The dashed lines are observed ratios. Where they intersect the heavy gray line are the ratio solutions.
Casual inspection shows that contrast ratios like the ones shown by the blue dashed lines are insensitive to photon energy above about 500keV and have no solution below(not very useful). Contrast ratios like the green dashed lines have a weak dependence below about 30keV and are multi-valued(use with caution). Ratios like the red lines are in the "sweet spot" with contrast-energy dependencies that can give meaningful results.
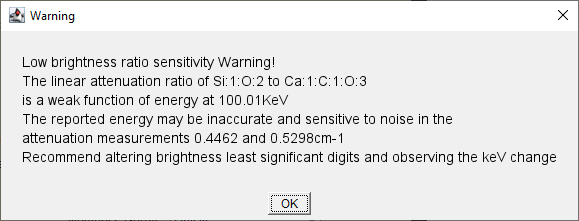
A warning message will appear if the contrast ratio is a weak function of energy;
1. A simple test is to create a synthetic digital image and scan it with a monochromatic projector. Reconstruct the sinogram with your reconstruction package. It should return the synthetic image plus some noise. A more severe test is to scan it with a bremsstrahlung scanner and apply a beam hardening correction during reconstruction.